|
User Defined Scatter Graph |
  
|
|
User Defined Scatter Graph |
|
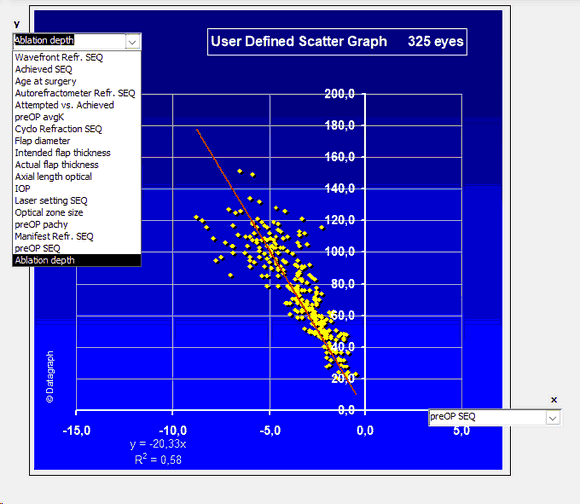
User defined scatter graphs allow you to display the correlations between various parameters. The content of both, the Y and the X-Axis can be selected from a drop down list. After that the data points are shown and a trend line and correlation coefficient are shown.