|
IOL Prediction Error (Box Plot) |
  
|
|
IOL Prediction Error (Box Plot) |
|
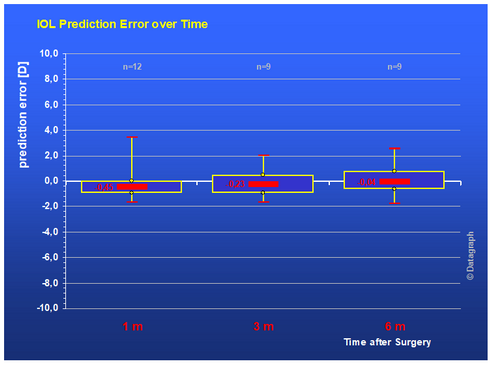
IOL Prediction Error over time is a simplified version of the popular Box and Whisker graph showing the median, 25% and 75% percentile (lower and upper end of the boxes) and min and max values of the IOL prediction error at different postOP time intervals. Patients must be filed as IOL-Cataract treatmetns and calculated and actually implanted IOL power need to be entered on the IOL-Tab in the data entry form to make patients appear on this graph.
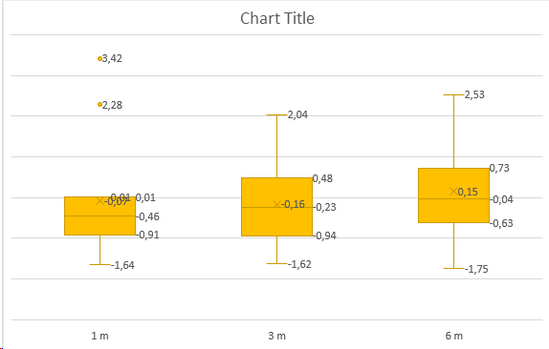
Some times -for scientific publications- it may be necessary to show more detail statistics in the Box and Whisker graph. This can be accomplished by exporting the actual selected data to MS Excel. Click on Show-Data and then use the export to excel button at the bottom of the pop up table.
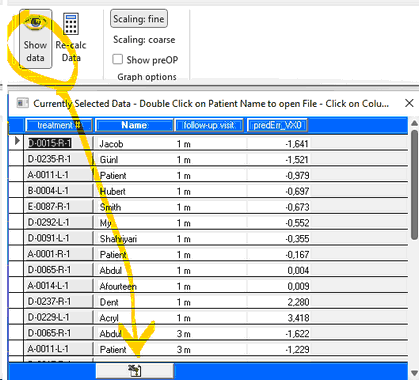
Then the data can be pasted into a regular Excel spread sheet and the box and whisker graph made to show outlier data as well as mean values (x).