|
Coma |
  
|
|
Coma |
|
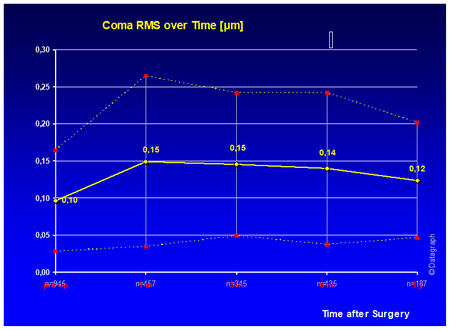
Similar to HO RMS the Coma Terms Z7 and Z8 can be plotted as RMS magnitude over time. This shows whether coma as been induced or reduced on average.
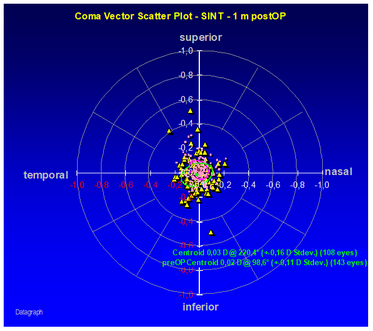
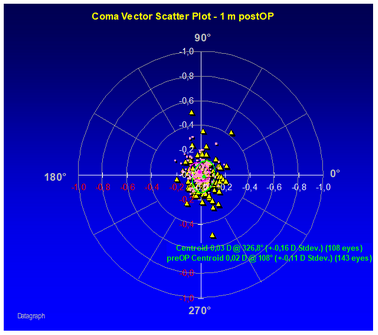
But since coma is a vector similar to astigmatism, it should be seen as a magnitude and axis scatter plot.
Unlike the astigmatism axis the coma plot axis is not doubled however. Coma can be oriented from 0 to 360° by definition.
Graphs can be displayed for individual postOP intervals or show pre and PostOP data points on the same graph. Centroid plots will show the overall magnitude and direction.
Your Coma data may have a mirror symmetry for left and right eyes and we recommend to use a normalized coma vector scatter plot looking at S-N-I-T (superior-nasal-inferior-temporal) distributions rather than using the actual coma axis.