Navigation: Making Graphs > More Visual Acuity Graphs >
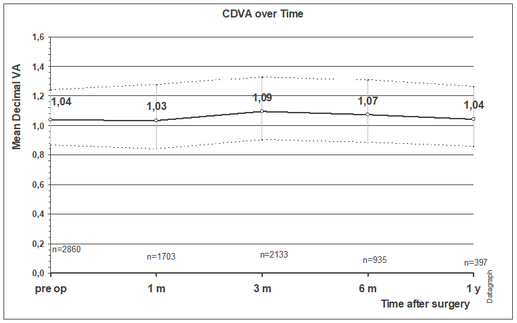
CDVA over Time
This graph plots the mean decimal VA over time with +-1 Stdev. and number of eyes (n=) per follow up interval.